Every measurement is traceable
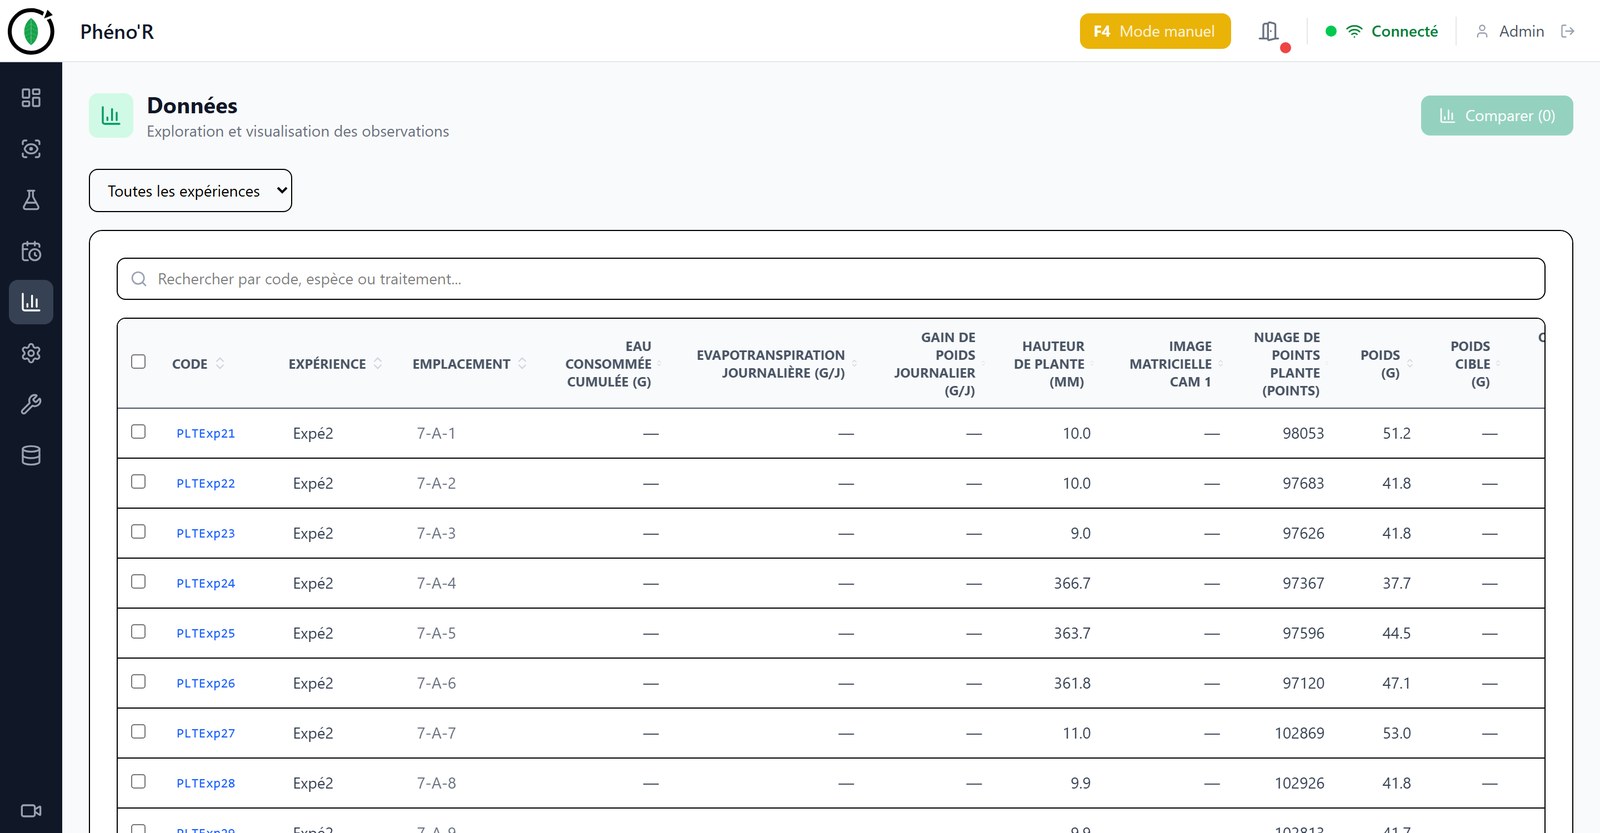
Every measurement becomes an observation — a mass, a height, an image — linked to the plant, the experiment and the time of measurement. Start-ups, job completions and faults are logged. The history of each experiment is complete and ready to use.
Indicators calculated automatically
After each measurement, calculations run on the control PC, with no manual handling:
- from weighings and waterings: water consumed, evapotranspiration, fraction of transpirable soil water (FTSW), growth rate ;
- from laser scans: height and point cloud of each plant;
- from colour images: leaf area and colour indices.
Results are viewed in the supervision interface like any other measurement, as tables and charts.
Files on the laboratory storage
Images and fluorescence measurements are copied automatically to the university’s storage server; the database keeps their reference. Data can be exported as CSV for statistical analysis.
An open architecture
Optima PLC controller, dedicated acquisition applications for each instrument, a single database, web supervision: each building block has a clear role, and the machine can take on new instruments.
← Pheno’R · Measurements and instruments · Web supervision · Data and analysis